"Today Tab 2.0" explores the new version of the Today Tab in detail.
This new version of the Today Tab (introduced in June of 2026) was built with a simple goal: improve historical win rates by being more selective. In other words, fewer signals, but a greater focus on quality.
While they may trigger less frequently than some existing Today Tab strategies, they have demonstrated stronger historical win rates, making them strategies we would pay particularly close attention to when reviewing opportunities.
What is the Today Tab 2.0?
The Today Tab 2.0 is an all-in-one view for a small selection of prebuilt technical strategies. You can see the chart, the options TradeMachine® would use for the strategy (if active), backtest results, and more all in one page.
It scans all U.S. exchanges at a minimum of every 30 minutes during market hours looking for new triggers.
These strategies are scanned Intraday. If the conditions change intraday, the current status next to the trigger will be updated. You can learn more about the status and what it means here: Active/ Near Active Status. If a trigger moves beyond the range for the “Near Active” trigger, it will be removed from the page.
Navigating Today Tab 2.0
There are several key parts to Today Tab 2.0, when you first log on this is what you will see.
.png)
When logging on, the chart will default to SPY, but you can quickly change the ticker from the box at the top left of the stock chart box. Additionally, you will always see the current stock price/intraday move for SPY and QQQ.
Easiest and most importantly, the box on the top right of the screen when you log in will show you a summary of the currently active and near active strategies.
.png)
Today’s Strategy Totals shows the details for both Active and Near Active triggers with a list of clickable tickers below the coordinating section.
On this particular day, there was 1 Active trigger (seen on the left, in green) and 9 Near Active triggers (seen on the right, in red). Also crucial, each ticker below the box is clickable to see the full strategy and trigger details.
Setting Alerts
The easiest way to know what is happening on this page before you even load it is to use the alerts feature.
By setting alerts, you will be emailed 2 times per day maximum around 10:15 am ET and at 3:45 pm ET. Alerts are only sent when there are active or near active triggers, so many days you may get no alerts - and that is normal.
To add alerts: Click the “Get Email Alerts” button at the top of the “Trade Entry Triggers” table.
.png)
A box will pop-up with some details and your TradeMachine® email already populated. Confirm your email address and click the blue “Turn on Email Alerts” button at the bottom.
.png)
You will see an indicator that shows alerts are turned on at the top of the “Trade Entry Triggers” (this is also where you can turn it off or update your email address for these alerts).
.png)
Viewing Options
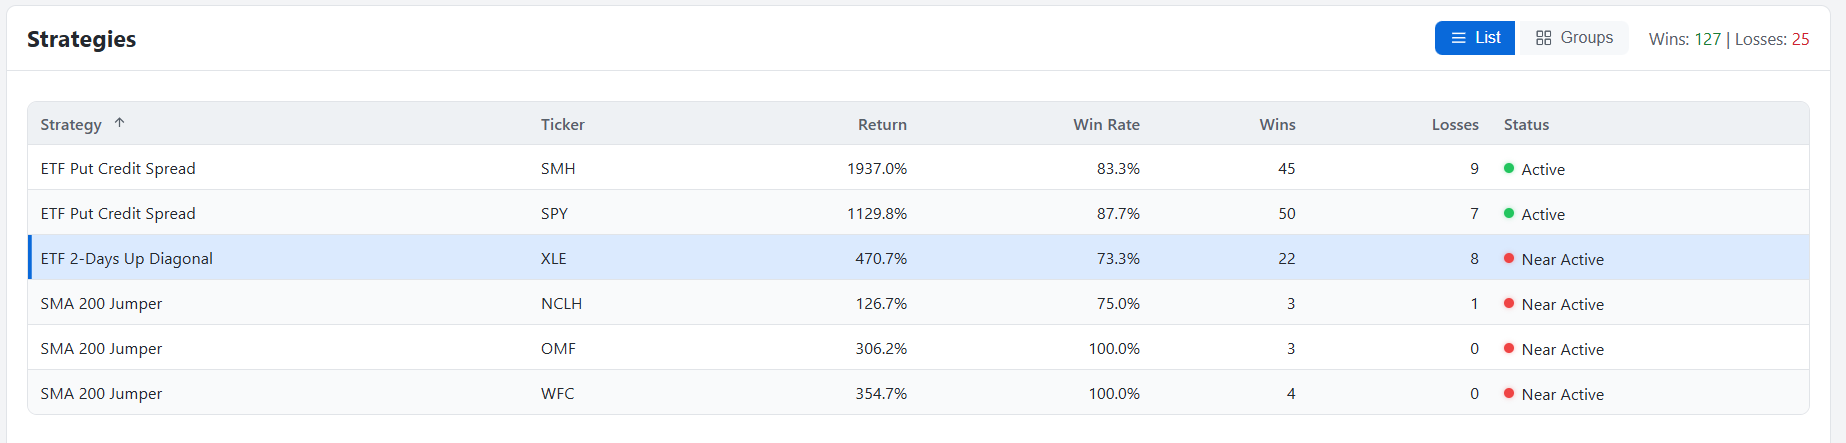
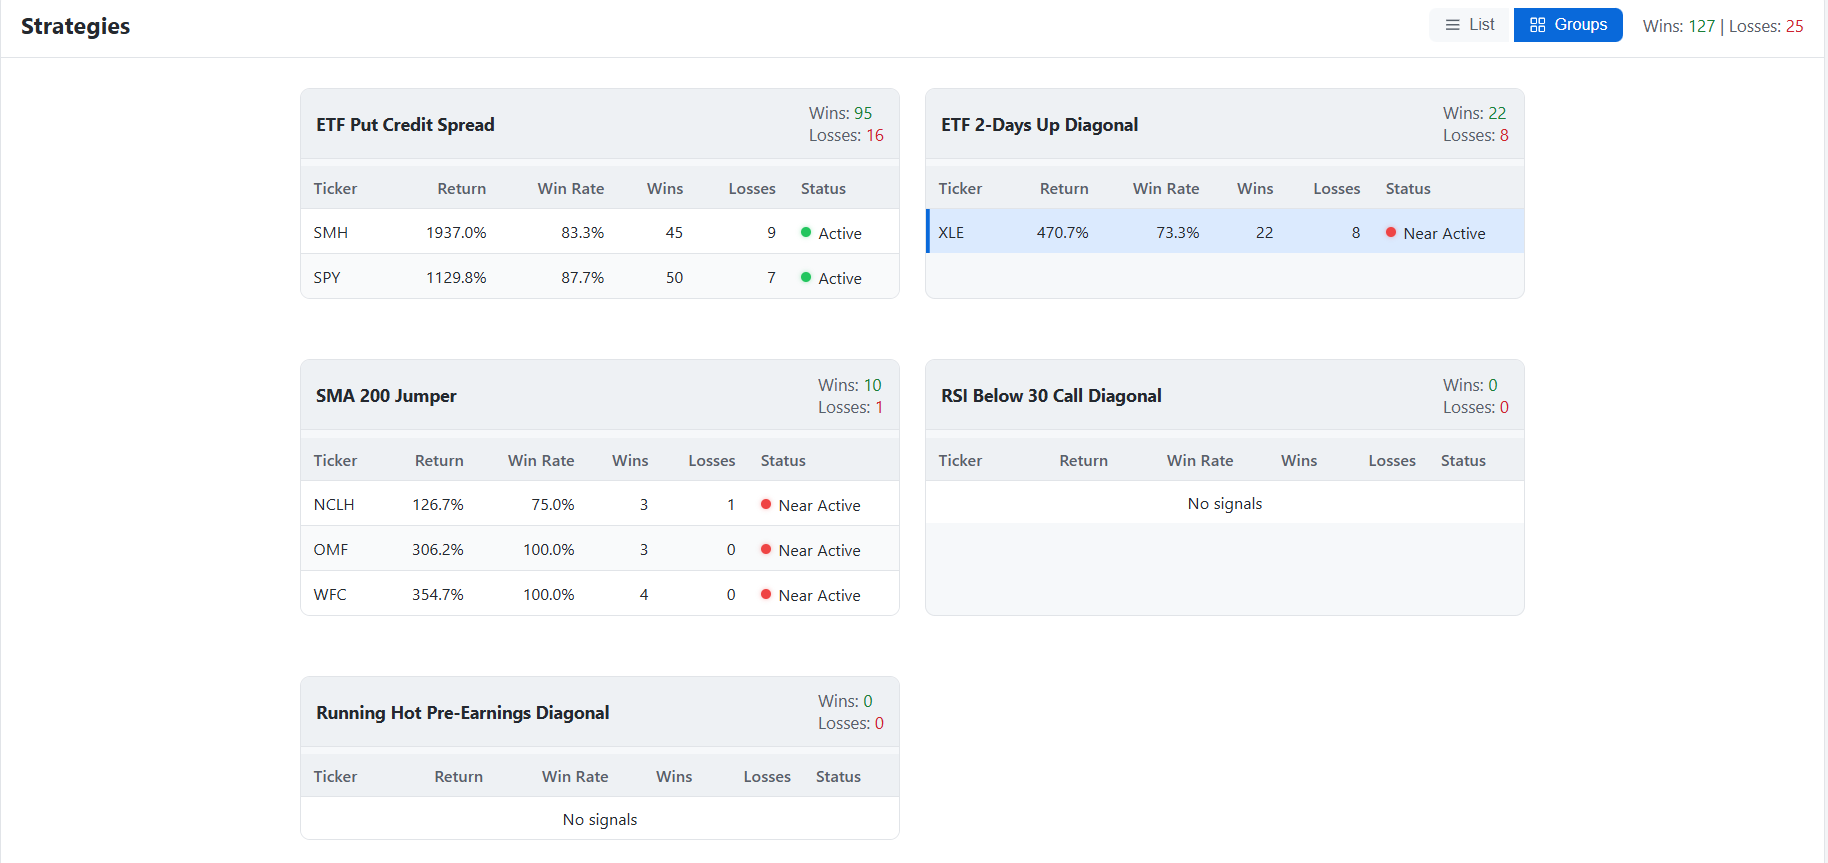
There are 2 ways to view the “Strategies” section at the bottom of the screen. You can quickly switch between the options at the top right of that section using the “List” and “Groups” buttons.
.png)
List
Groups
Active/ Near Active Status - What does it mean?
Active
Active is shown intraday when all technical conditions for the strategy are currently met. You can find the individual open requirements for each strategy on the strategy pages, every strategy has a specific set of technicals that must be met before they will become active.
Active triggers will have a green dot under status in the list or groups under strategies at the bottom of the page.
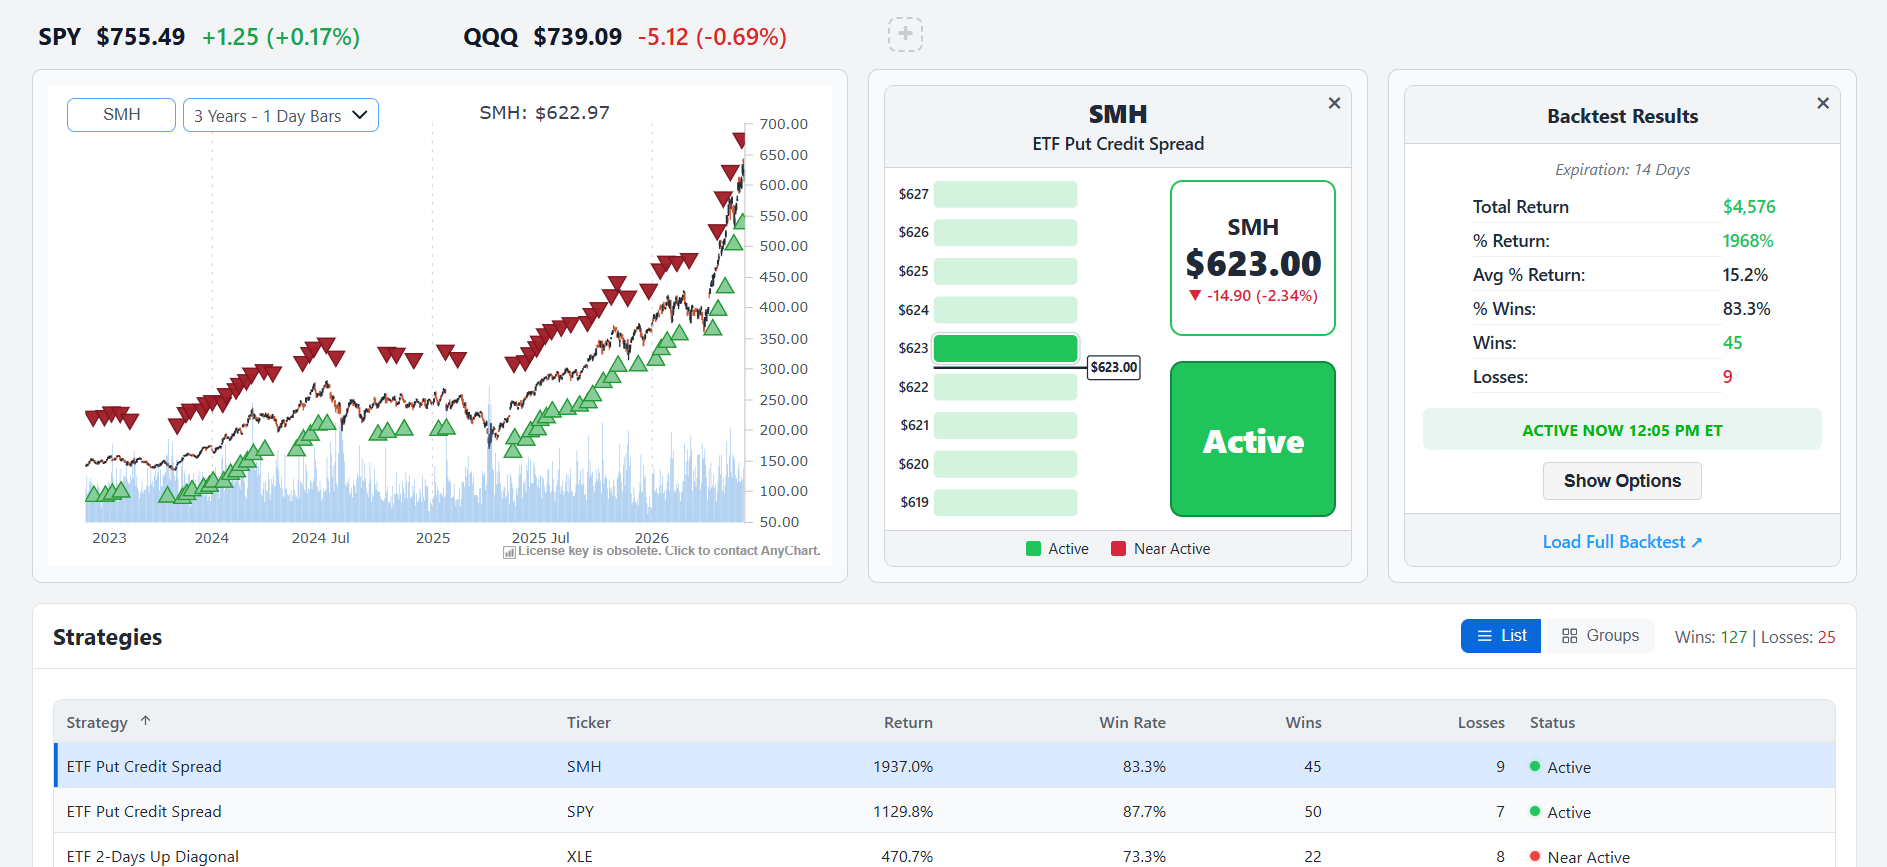
When you click on a specific trigger that is currently active, a few things on the page will change:
The stock chart will switch to the chart for that ticker and show you every open and close (denoted by the green [open] and red [close] arrows on the chart).
The middle box shows you a summary of the trigger including current stock price/intraday move, current status (active or near active), and the chart that shows what would happen with a to the status if the stock price moved up $4 or down $4.
The box on the top right shows the backtest results, including; total return, percent return, average percent return, percent wins, number of wins, and number of losses.
At the bottom of this box there are 2 critical options:
Show Options: This button shows the exact strike and expiry TradeMachine® would use for this trigger.
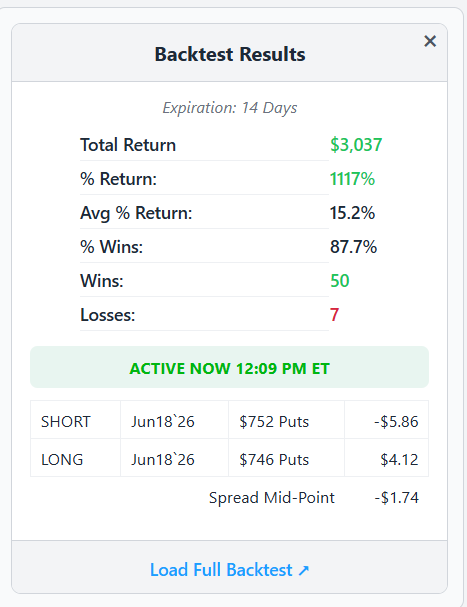
Load Full Backtest: This will take you to the Backtest tab where you can see the full strategy settings.
Near Active
Near Active is shown intraday when all technical conditions for the strategy are within $4 of the current stock price ($4 above or $4 below). You can find the individual open requirements for each strategy on the strategy pages, every strategy has a specific set of technicals that must be met before they will become active.
.png)
As with “Active” triggers, when you click on a specific trigger that is currently near active, a few things on the page will change:
The stock chart will switch to the chart for that ticker and show you every open and close (denoted by the green [open] and red [close] arrows on the chart).
The middle box shows you a summary of the trigger including current stock price/intraday move, current status (active or near active), and the chart that shows what would happen with a to the status if the stock price moved up $4 or down $4.
The chart showing what would happen to the status based on the stock moving up $4 or down $4 is critical here, because it gives users a way to know what it would take for the trigger to become active.
The box on the top right shows the backtest results, including; total return, percent return, average percent return, percent wins, number of wins, and number of losses. In this case, there will not be a “Show Options” button.
Load Full Backtest: This will take you to the Backtest tab where you can see the full strategy settings.
Strategies
Today Tab 2.0 focuses on a few strategies that have demonstrated stronger historical win rates . You can review the full strategy details using these links.
Want to Learn More?
On 9/15/2026, we hosted a webinar discussing Today 2.0 and the strategies in detail followed by a live Q&A session. You can review those recordings below to learn more about Today 2.0 and TradeMachine® in general.