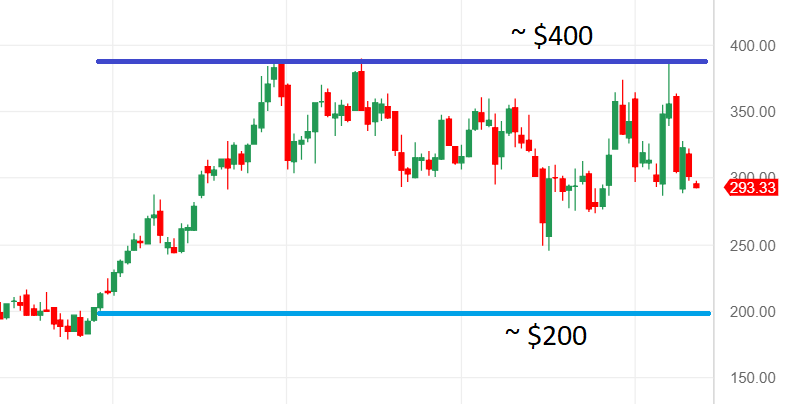
We'll use the following chart as an example to discuss how Fibonacci technical alerts work on TradeMachine®. We are approximating the high as $400 for simplicity:
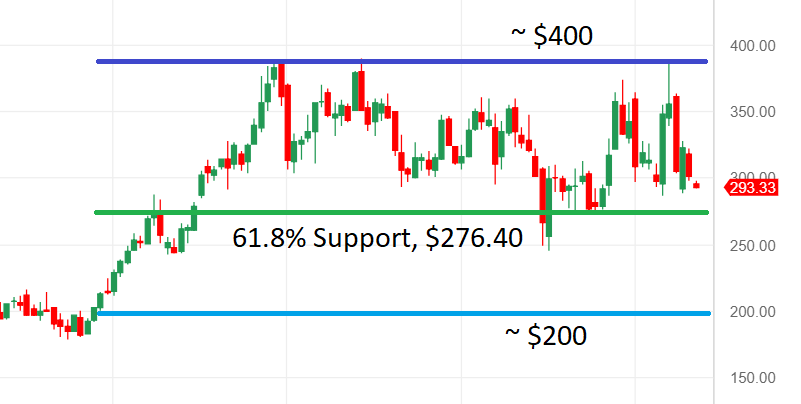
Our Fibonacci Support example uses 90 days for the date range and 61.8% as the Fibonacci Support Level.
-
The calculation starts by taking the number of days from the "Days in Range" input and finding the high and low of the chart during that timeframe. In this example we're looking at about 90 days, and we're going to call the low $200 and high $400 to make it easier to walk through.
-
With a high of $400 and low of $200 during the time frame, the price range is $200.
-
Because we are setting an alert to indicate "support" (ie, a place where downward movement stops), the calculation takes the highest value within the dates ($400) and then sets a price that if the stock falls below, we will get an alert.
-
The support price is taken by multiplying the price range, $200, by Support Level, 0.618, which is $123.60. $123.60 is subtracted from the highest value ($400) to get the support price. $400 - $123.60 = $276.40
-
If the stock moves below $276.40 while the previous 90 day high and lows remain the same, the support will be triggered and an alert will be sent out.
Note: As time passes, the previous 90 day high lows will change as well. The $276.40 is not a static price, it is the current 61.8% Fibonacci Support price, but that price will change as the previous 90 day high/lows change.
- If you would like to set a fixed price at which you will be alerted, simply use Stock Below alert.
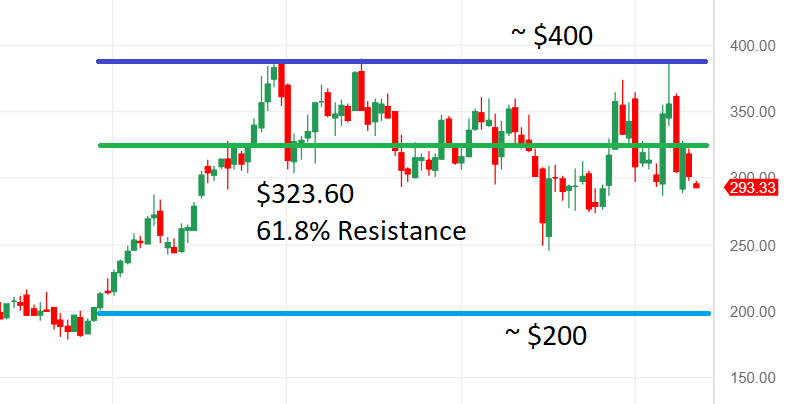
For Fibonacci Resistance, the logic is very similar, but the price works from the bottom up.
-
The calculation starts by taking the number of days from the "Days in Range" input and finding the high and low of the chart during that timeframe. In this example we're looking at about 90 days, and we're going to call the low $200 and high $400 to make it easier to walk through.
-
With a high of $400 and low of $200 during the time frame, the price range is $200.
-
Because we are setting an alert to indicate "resistance" (ie, a place where upward movement stops), the calculation takes the lowest value within the dates ($200) and then sets a price that if the stock rises above, we will get an alert.
-
The resistance price is taken by multiplying the price range, $200, by Support Level, 0.618, which is $123.60. $123.60 is added from the lowest value ($200) to get the resistance price. $200 + $123.60 = $323.60
-
If the stock moves below $276.40 while the previous 90 day high and lows remain the same, the support will be triggered and an alert will be sent out.
Note: As time passes, the previous 90 day high lows will change as well. The $323.60 is not a static price, it is the current 61.8% Fibonacci Resistance price, but that price will change as the previous 90 day high/lows change.
- If you would like to set a fixed price at which you will be alerted, simply use Stock Above alert.