What is Dollar Cost Averaging?
Dollar cost averaging (DCA) is an investment strategy commonly used for long term investing in which an investor makes planned purchases of an equity at a set pace and amount regardless of the asset's price.
The benefits of dollar cost averaging are that it helps the investor avoid common psychological pitfalls (like accellerated puchases or sales based on greed or fear) and reduces the effect of market timing on the overall portfolio.
With TradeMachine, you can back-test your DCA strategy ideas using the "Stock Dollar Cost Average" option under "Strategies"
To Use This Feature:
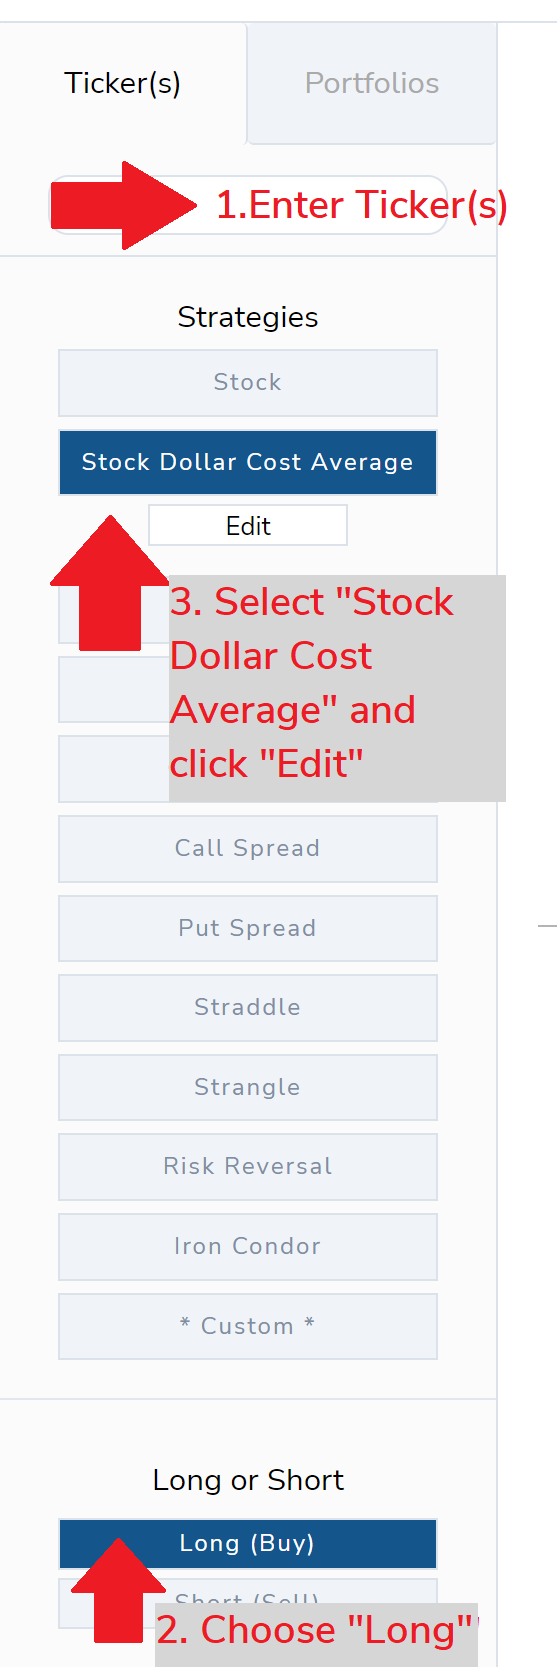
1.Start by adding a ticker(s).
2.Choose Long.
and
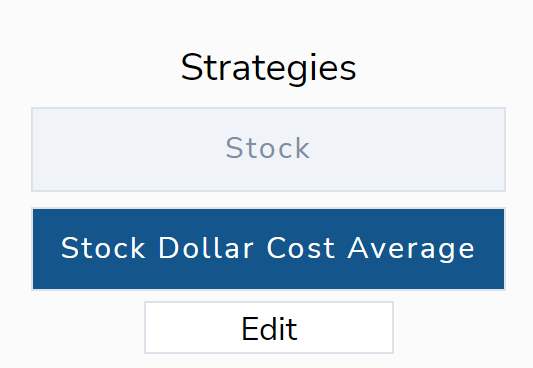
3. Choose Stock Dollar Cost Average.
This will open a new window where you can choose your custom dollar cost average strategy.
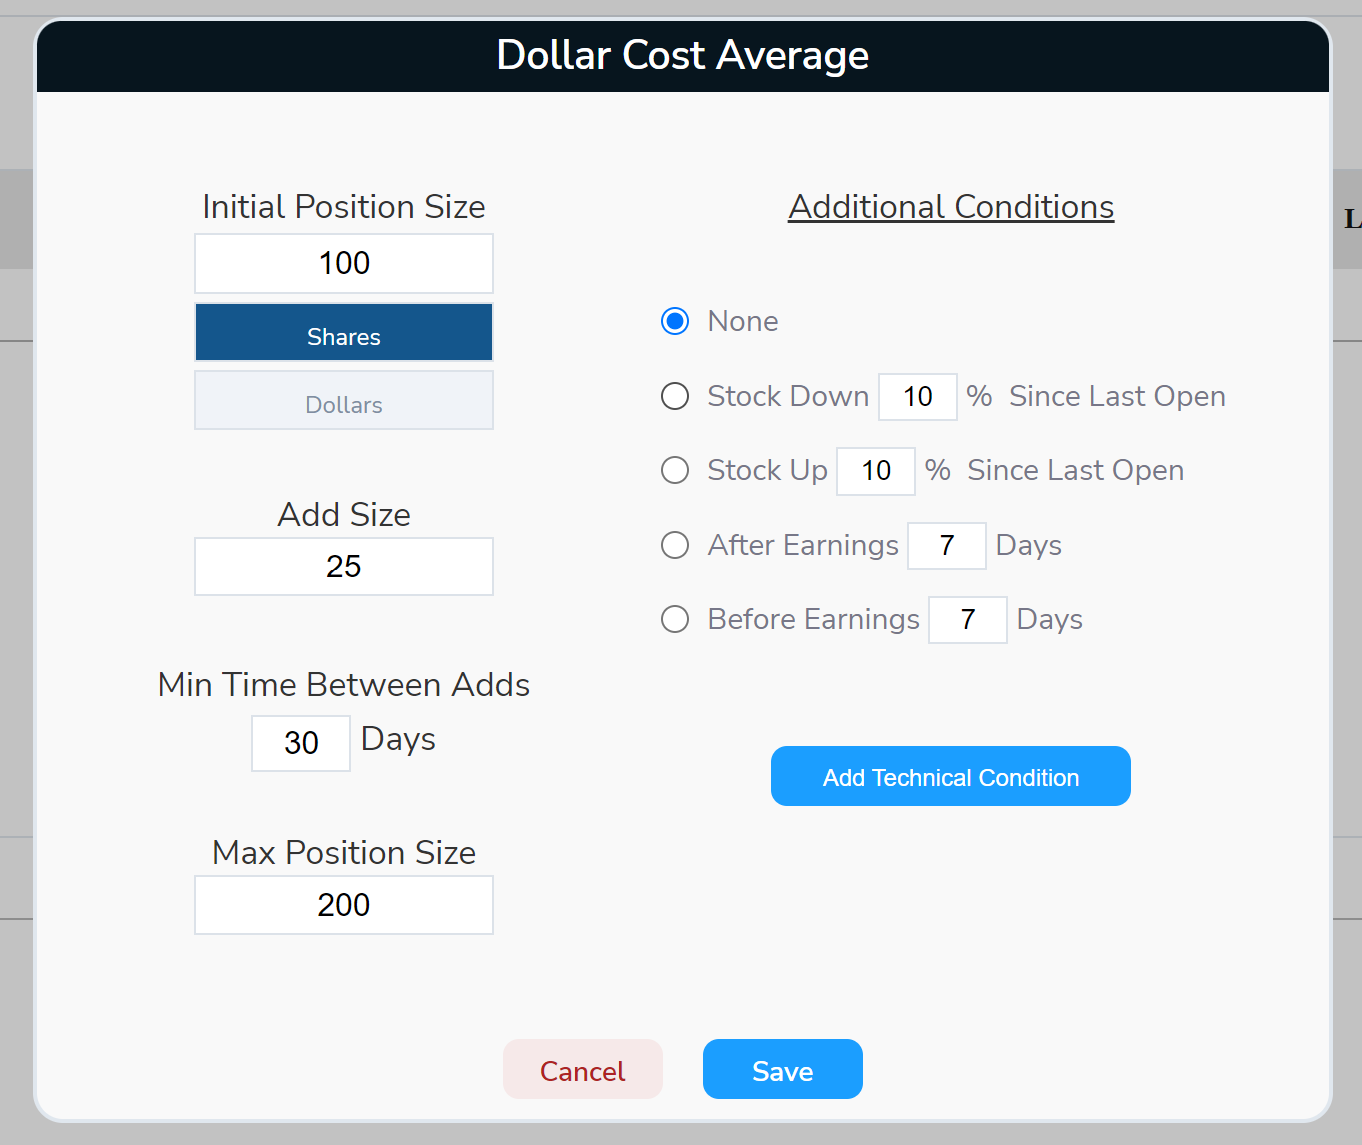
First, choose whether you would like to add to your position by a set number of dollars or a set number of shares.
Dollars is the most popular choice for dollar cost averaging because share prices change.
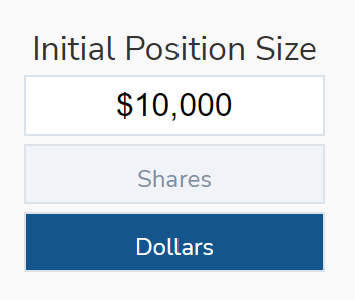
"Initial Position Size" tells TradeMachine® how much to invest on its first purchase.
To set the total amount you would like to allocate to this stock (or each stock in your portfolio), enter your Max Investment.
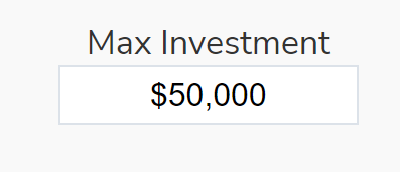
"Max Investment" tells TradeMachine® when to stop making stock purchases according to your DCA plan. When the Max Investment is hit, the position is "full."
Next, tell TradeMachine® how much you would like to invest each time your DCA strategy triggers.
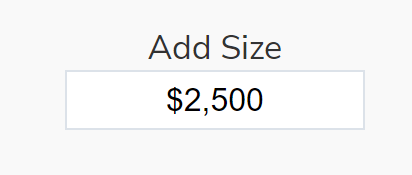
"Add Size" tells TradeMachine® that you would like to test buying X dollars of stock (or X number of shares) each time the trigger occurs until the MAX INVESTMENT level is hit.
Finally, set the minimum time between adds.

"Min Time Between Adds" tells TradeMachine® the minimum number of calendar days between each purchase of stock.
While you may have a strategy in place for when TradeMachine® will add, if it hasn’t been at least X number of days since the last position was added, TradeMachine® will not DCA until X number of days has passed, even if the strategy settings you have in place trigger.
Under “Additional Conditions" you can further customize your DCA strategy.
Adding conditions will inform TradeMachine® if there are additional rules to follow when it opens each DCA position.
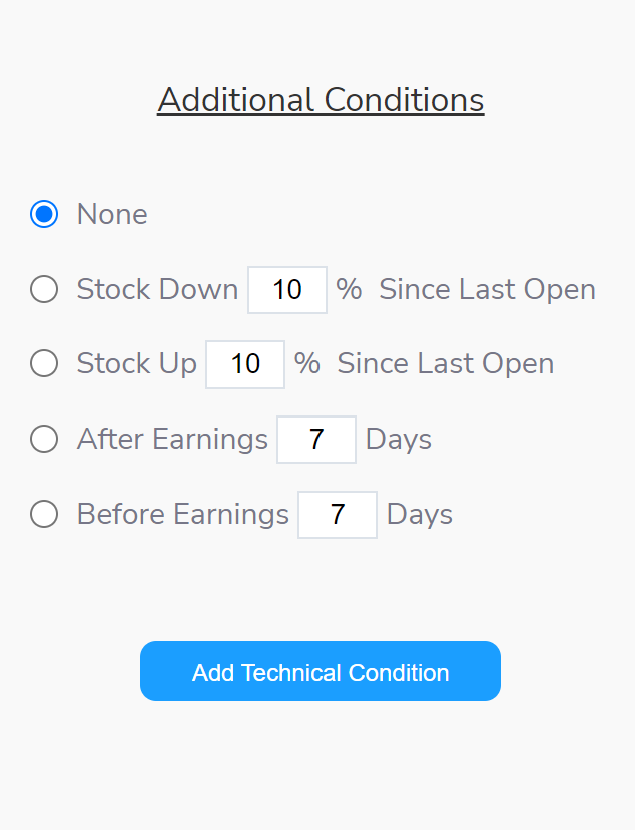
You can choose “None” to simply add every time the “Minimum Time Between Adds” is hit.
You can choose to add only when the stock was down a certain percentage since the last open or if the stock was up a certain percentage since the last open.
If we open this strategy today and have “Stock down 10% since last open” selected, TradeMachine® would not open the next position until the stock was down 10% from today's price and X number of days has passed. Vice versa for "Up 10%."
While this may be a good strategy for some, we would like to note that if a stock does not go up or down X% after each additional purchase, you may never reach your max investment.
You can also choose to add only X number of days before or after earnings announcements.
Or, you can add Technical Open Conditions.
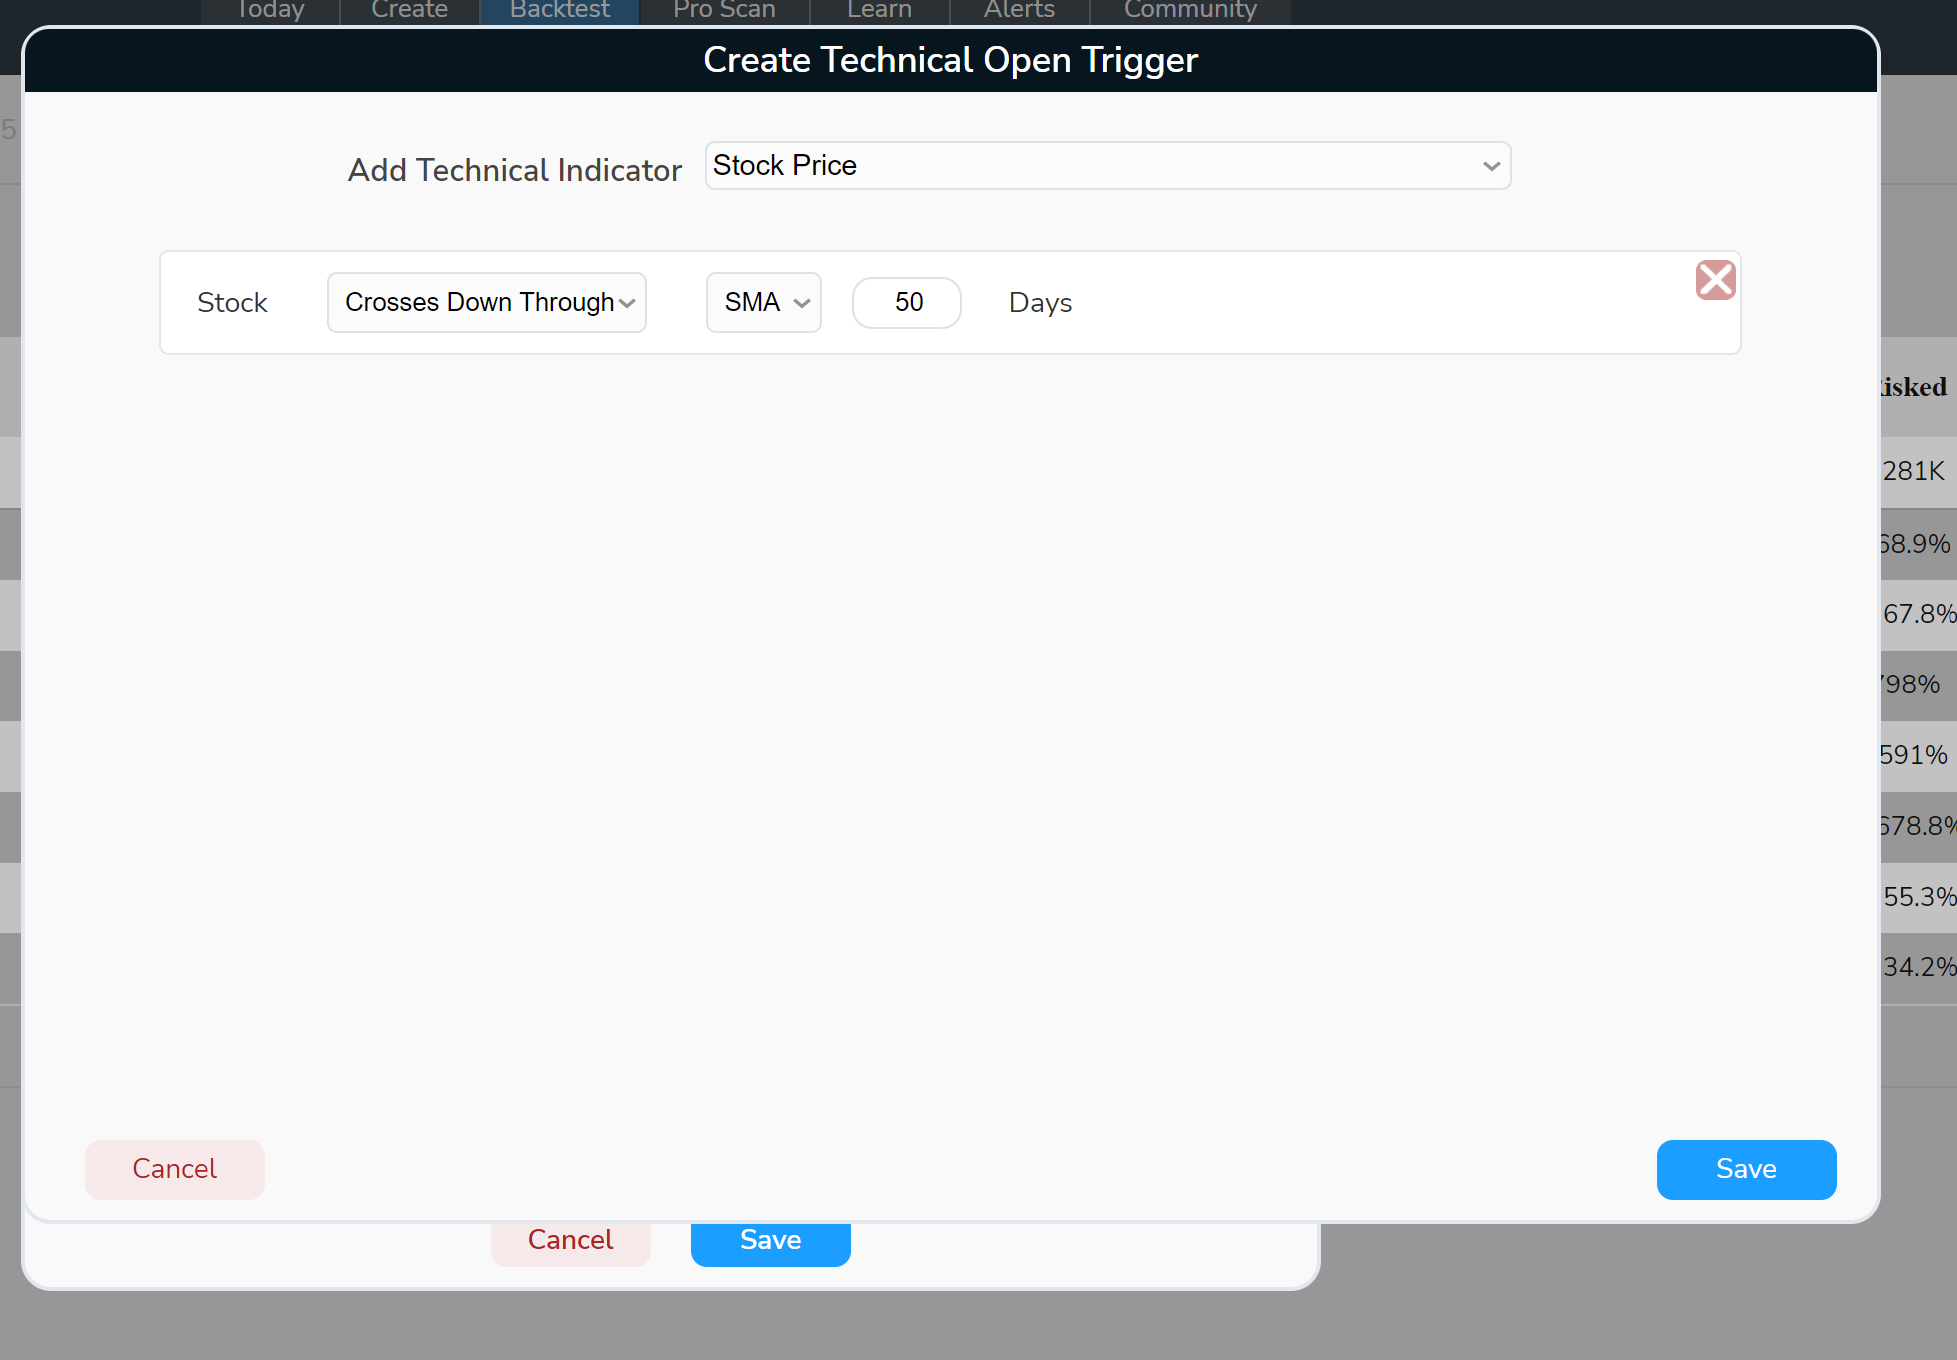
When you click “Add Technical Condition” a new dialog box will appear, allowing you to set your own custom technical trigger.
Some commonly used strategies to dollar cost average include adding when the stock price goes below a moving average. You can add as many technical conditions as you would like.
Just click "Save" to add your Technical Open Trigger to your DCA strategy.
Once your strategy is complete, click "Save" again in your "Stock Dollar Cost Average" box to run the back-test.
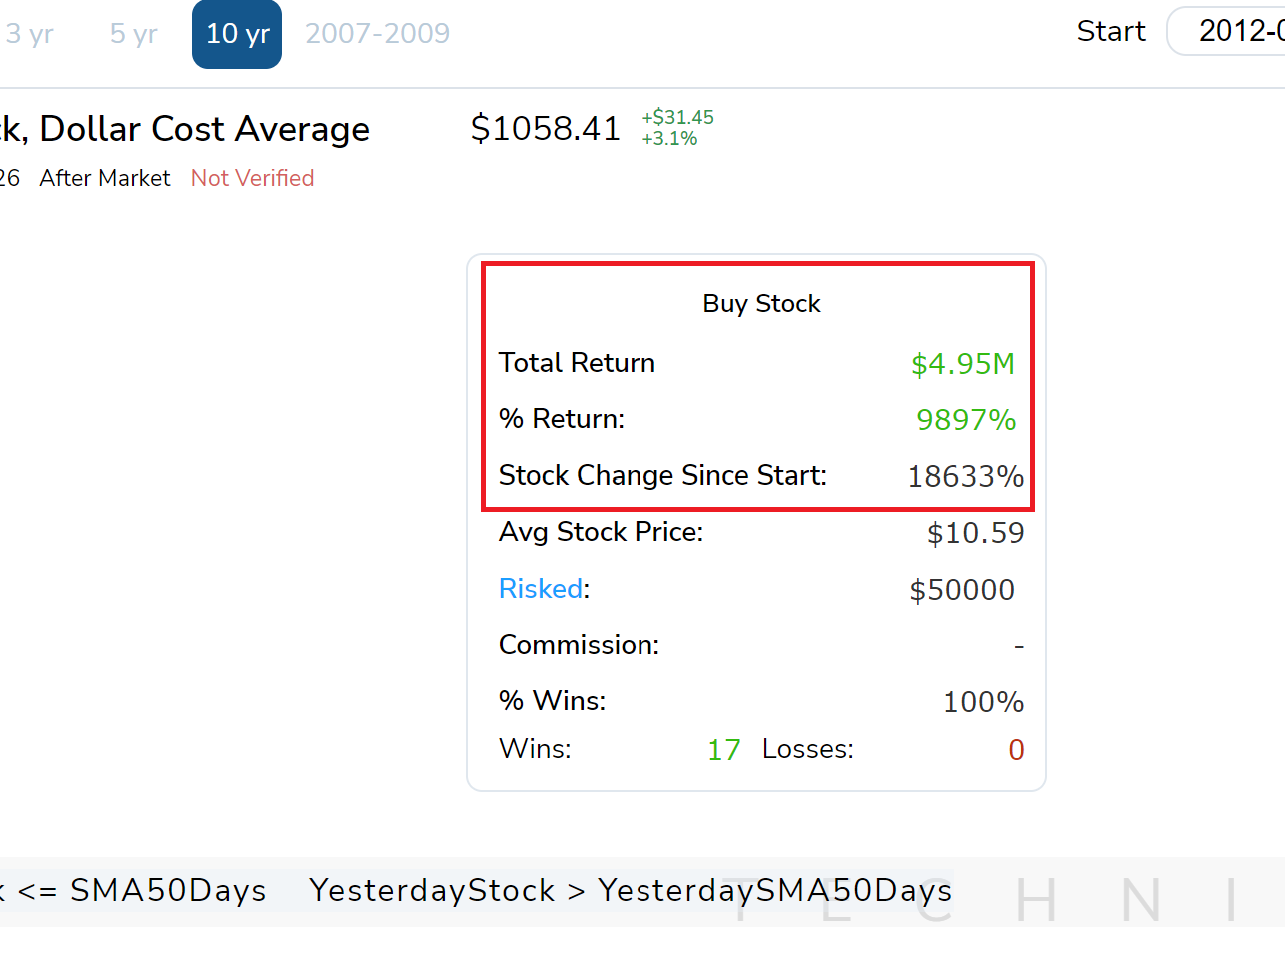
When the back-test is complete you can see the details of how your strategy would have historically performed.
You can also cross compare the % Return of your strategy versus the stock performance since the beginning of your back-test on the back-test summary tile.
See it in Action: