TUTORIAL VIDEO
While we explain everything in great detail below, we do have a video tutorial as well for technical back-testing in TradeMachine® Pro. Here is that video:
TradeMachine® Pro Technical back-testing
TECHNICAL INDICATOR: "CML MAMMOTH"
At Capital market Laboratories®, we take an empirical view of trading, whether that be momentum trading, non-directional option trading, or in this case, technical trading.
The name 'Mammoth' is derived from this model's focus on moving averages (MA) and momentum (MO).
Hypothesis
By using the position of various moving averages relative to each other and the current stock price, together with short-term momentum, and key levels of the volatility indicators Keltner Channels and Bollinger Bands, there was a short-term technical signal that outperformed the market.
Here is a quick video explainer:
CMLviz Mammoth Technical Indicator from CML Support on Vimeo.
How to Use it in TradeMachine® Pro
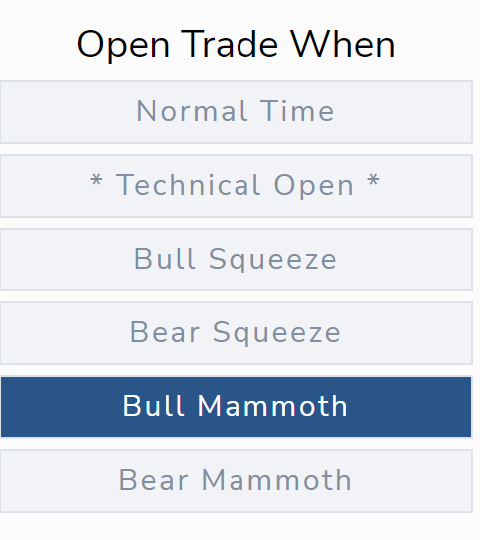
Using the indicator will be as easy as everything else in TradeMachine®. Click a button.

The Idea -- Broadly
The idea behind all of this, and all technical analysis, is that past price behavior and key levels are watched by so many people, that patterns can repeat, and if those patterns can be identified ahead of time, they can create higher probability trades than those entered without them.
I. BULLISH MODEL: Moving Averages
-
The further above the stock price is relative to the 50-day simple moving average, the worse the short-term technical bullish strength was to follow.
(variable name: ma1_rel_ma50) -
The further above the 8-day exponential moving average is above the 21-day exponential moving average, the better the short-term technical bullish strength was to follow.
(variable name: ma8_relma21) -
If the 50-day simple moving average is above the 200-day simple moving average, sometimes called the 'golden cross', that has historically been a signal of short-term bullish strength to follow.
(variable name: ma50>200)
II. BULLISH MODEL: Momentum
-
Stocks that had experienced two consecutive down days showed a poor short-term bullish signal to follow.
(variable name: stock_1d_and_2d_down) -
The larger the one-day and two-day stock changes prior, the better the short-term technical bullish strength was to follow.
(variable names: stock_1d_perc and stock_2d_perc).
III. BULLISH MODEL: Ranges, Volatility, and Key Levels
-
The further above a stock price was relative to the lower Keltner Channel, the worse the short-term technical bullish strength was to follow.
(variable name: stock_rel_keltlow) -
If a stock price was above the high Bollinger Band, that was an historically better technical bullish indicator for the short-term to follow.
(variable name: stock>boll_high) -
The wider the Keltner Channels were relative to the stock price, the better the short-term technical bullish strength was to follow.
(variable name: keltner_width)
The details behind the methodology, testing results, machine learning, and statistics are inclued at the end of this dossier.
How It's used in TradeMachine® Pro
For the back-tester, we look for a MAMMOTH indicator above 9.9% with these rules:
- That level must be breached with an up day of at least 1%.
*** Close Rules:**
-- BULL CLOSE
Any of two things will cause the bull signal to close a trade in a back-test:
(1) The options used in the back-test expire.
OR
(2) A stop or limit is hit.
BULLISH MODEL: DETAILS AND EMPIRICAL RESULTS
We tested and optimized the triggers for this technical signal. The results were robust.
-
Test Group: The 270 most liquid optionable stocks over the last five-years.
-
Basline: Buying a call option closest to two-weeks in expiration and rolling it after every close.
-
Number of Trades: The back-test produced more than 27,000 trades over the five-year period.
-
Testing: We built the model with a random sample of 2/3 of the data. We tested the resulting model on the remaining 1/3 of the data.
-
Trigger Rule: If the predicted model value was > 9.9% over the upcoming two-week period, we triggered a trade.
-
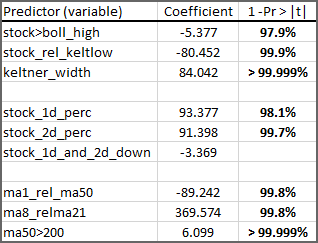
Parameter Results:

(the intercept was -202.133)
And the results for the 9,000 out of sample trades were as follows (for every two-week period):

With greater > 99.999% statistical significance, the BULLISH MAMMOTH indicator outperformed the standard call strategy.
In English, based on the data we have over the last five-years and tens of thousands of trades using the 270 most liquid optionable stocks, there is a high probability that the 'MAMMOTH INDICATOR' rules we have found are in fact superior to a standard rolling call strategy, even during a raging bull market.
I. BEARISH MODEL: Moving Averages
-
If the stock price is above the 200-day simple moving average, the worse the short-term technical bearish strength was to follow.
(variable name: ma1>200) -
If the 50-day moving average is above the 200-day simple moving average, the worse the short-term technical bearish strength was to follow.
(variable name: ma50>200) -
The further the stock price is above the 50-day moving average, the better it was historically for a short-term bearish signal.
(variable name: ma1_rel_ma50) -
The further the 8-day EMA was above the 21-day EMA, the worse it was historically for a short-term bearish signal.
(variable name: ma8_relma21)
II. BEARISH MODEL: Momentum
-
Stocks that had experienced two consecutive down days showed a stronger short-term bearish signal to follow.
(variable name: stock_1d_and_2d_down) -
The larger the two-day stock change prior, the worse the short-term technical bearish strength was to follow.
(variable name: stock_2d_perc).
III. BEARISH MODEL: Ranges, Volatility, and Key Levels
-
The further above a stock price was relative to the higher Bollinger Band, the better the short-term technical bearish strength was to follow.
(variable name: stock_rel_bollhigh) -
The wider the Bollinger Bands were relative to the stock price, the better the short-term technical bearish strength was to follow.
(variable name: bollinger_width_rel_stock)
The details behind the methodology, testing results, machine learning, and statistics are inclued at the end of this dossier.
How It's used in TradeMachine® Pro
For the back-tester, we look for a MAMMOTH indicator above 0%.
*** Close Rules:**
-- BEAR CLOSE
Any of two things will cause the bull signal to close a trade in a back-test:
(1) The options used in the back-test expire.
OR
(2) A stop or limit is hit.
BEARISH MODEL: DETAILS AND EMPIRICAL RESULTS
We tested and optimized the triggers for this technical signal. The results were robust.
-
Test Group: The 270 most liquid optionable stocks over the last five-years.
-
Basline: Buying a put option closest to two-weeks in expiration and rolling it after every close.
-
Number of Trades: The back-test produced more than 27,000 trades over the five-year period.
-
Testing: We built the model with a random sample of 2/3 of the data. We tested the resulting model on the remaining 1/3 of the data.
-
Trigger Rule: If the predicted model value was > 0% over the upcoming two-week period, we triggered a trade.
-
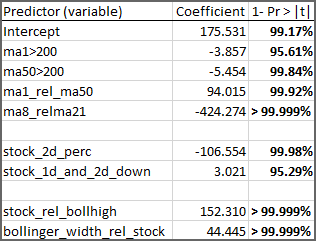
Parameter Results:

(the intercept was 175.530767244139)
And the results for the 9,000 out of sample trades showed greater > 99.999% statistical significance, the MAMMOTH indicator outperformed the standard put strategy.
In English, based on the data we have over the last five-years and tens of thousands of trades using the 270 most liquid optionable stocks, there is a high probability that the 'MAMMOTH INDICATOR' rules we have found are in fact superior to a standard rolling put strategy, even during a raging bull market.