A case study of option edge, win rates and probabilities.
Option Trading Edge in Utilities SPDR (ETF) (NYSEARCA:XLU)
PREFACE
There appears to be option trading edge in the Utilities SPDR (ETF) (NYSEARCA:XLU).
PREFACE: EDGE CAN BE MEASURED
If a trade wins more often than the probability that is priced in by the market, it has edge. In English that goes like this: A 30 delta (out of the money) put should end up in-the-money about 30% of the time (delta is roughly a measure of probability).
In other words, if we sold a 30 delta put, we would expect that we could have a winner 70% of the time, or 7 out of every 10 trades. Now we know how to find edge -- and here it is in real life.
EDGE DISCOVERY
If we can find an option strategy that has a 30 delta, but if selling it wins more than 70% of the time, then we have edge. Even further, even if it wins "just" 70% of the time, if the net profit is positive, then that's another measure of edge. When we have both, we have a great trading result, and that is exactly what we find with the boring, reliable and absolutely beautiful option trading instrument -- the famed Utilities SPDR (ETF) (NYSEARCA:XLU).
Utilities SPDR (ETF) (NYSEARCA:XLU)
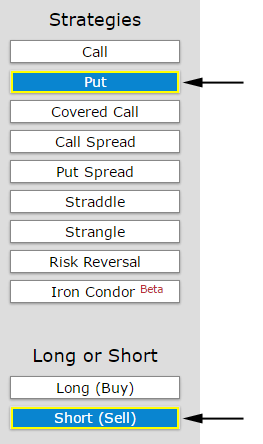
If we test selling a 30 delta put every 30-days in XLU over the last 3-years, this is the set-up:

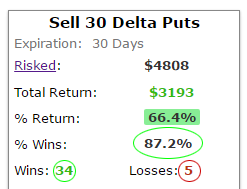
And this is what we find:

We can see 33 winning trades with 6 losing trades. That's a 85% win-rate on a 30-delta option that we would expect a 70% win-rate. Even more importantly, we see a 51.6% return over the last 3-years. But, if we go just one step further, we actually find even more edge.
We can do the exact same back-test, but this time, instead of trading 30-day options, we can test trading 60-day options over the same 3-year period. We just type in 60 days in the rollover entry:

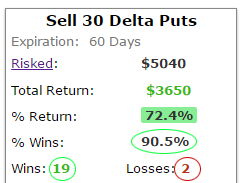
And now, here are those results:

Now we see 18 winning trades and 2 losing trades for a 90% win-rate on an option that should only have a 70% win-rate, and even further, we see a 55.2% return. We have just increased our win rate, increased our return and reduced our trading frequency -- which means less commissions.
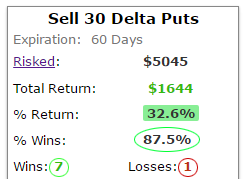
The next piece of analysis we need to look at is how this short put strategy every 60 days worked over the last year.

Obviously we're looking at fewer trades, but here we see edge again. 6 winning trades and 1 losing trade for a 85% win-rate and a 29.5% return.
SO WHAT JUST HAPPENED?
We can't look at the past and guarantee the future. But, we can absolutely look at the history of option trading in a stock or ETF, measure the expected probability of success and then see the actual success rate. In Utilities SPDR (ETF) (NYSEARCA:XLU) we see a higher win rate than the option market is pricing in for short puts and the result is superior returns.
Now this process goes yet further - beyond the famed Utilities ETF and beyond just short out of the money puts.